
Architecture field experts are nowadays used to the fact that the construction and the geoinformation worlds are two barely connected realities. Even the simple task of creating a context map (set aside a context 3d model) can give you goosebumps if the project doesn’t provide enough documentation and drawings.
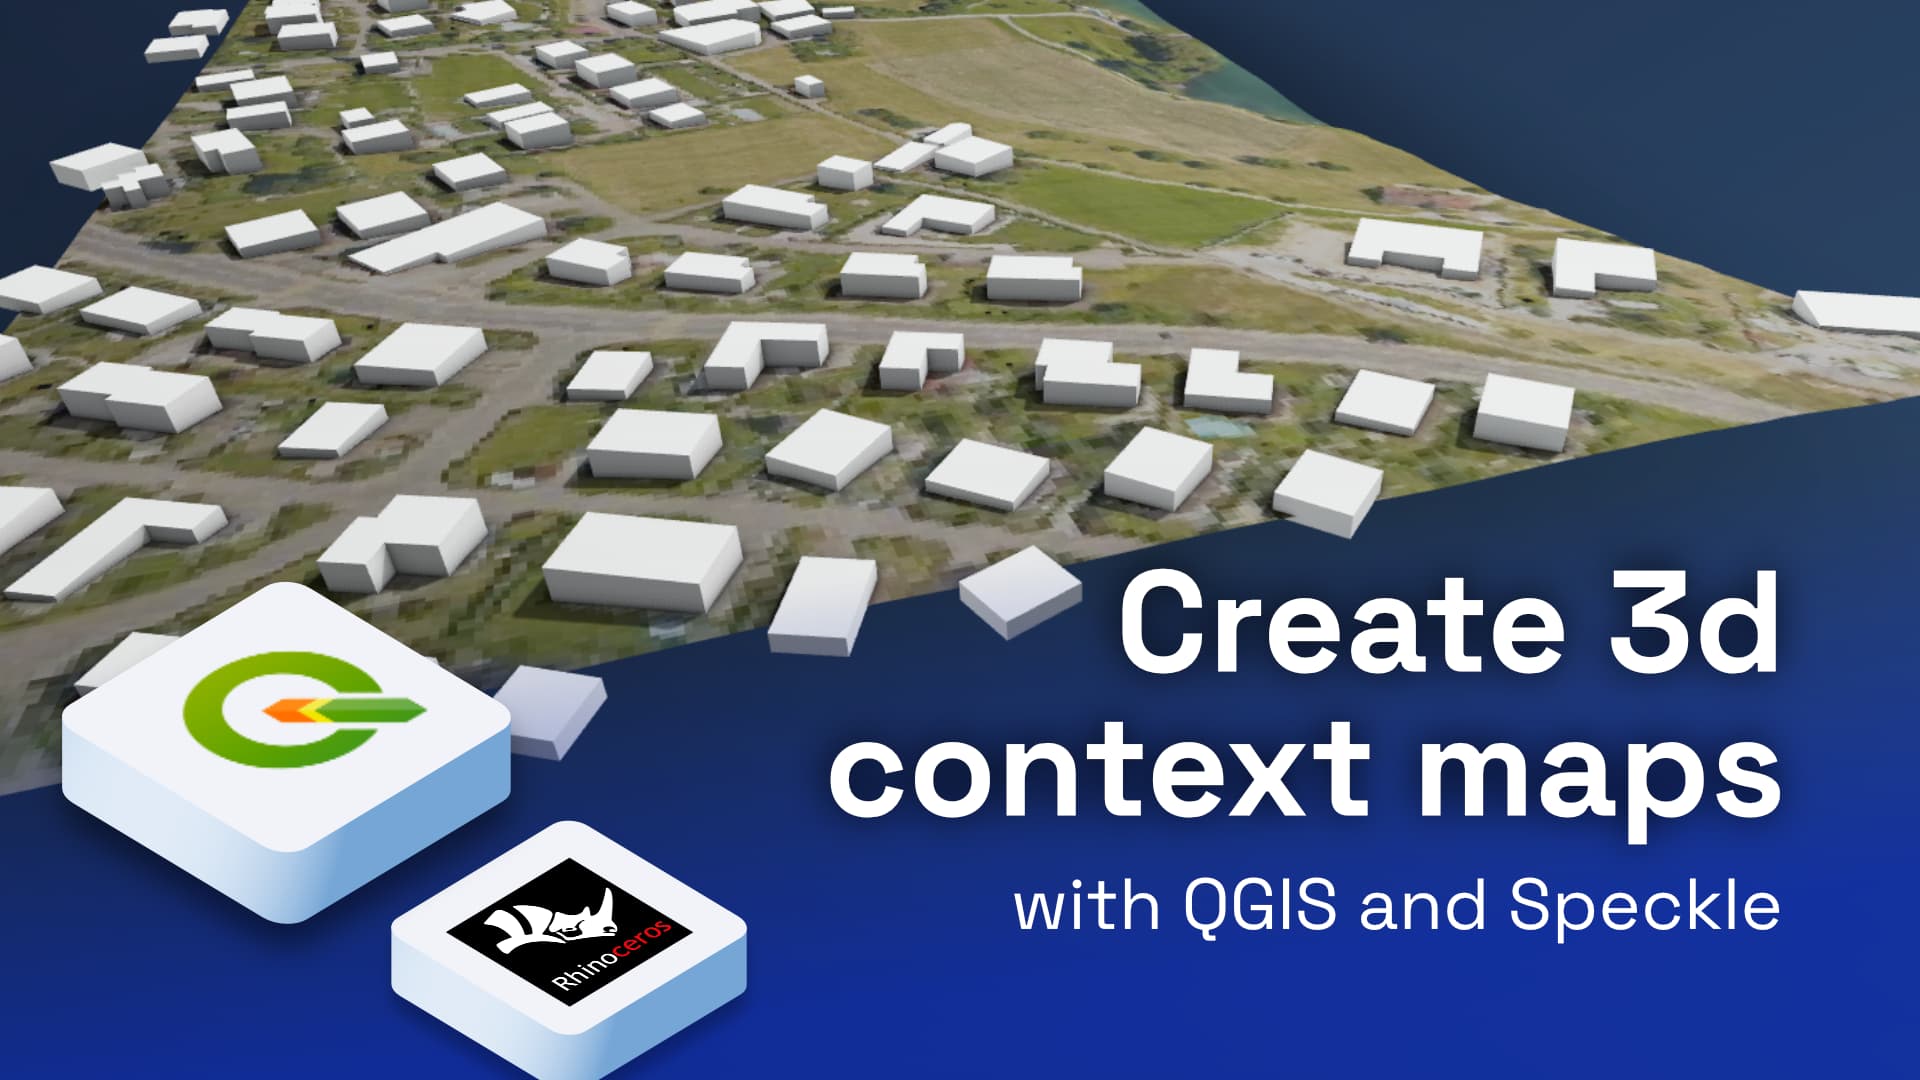
Luckily, there are more and more open-source data provided in form of files, API, and database queries, making access to necessary online data easier. Let’s imagine a scenario where we are working on a building project and need a simple context model for visualisation purposes. The below image is what you can get in just a few clicks using online data sources:
What we need to get to this stage is the elevation data, the texture & satellite image data, the outlines, and the height of the buildings. Here's a short video outlining what to expect from this blog:
Keep reading if you want to go through the steps in more detail.
Getting elevation and satellite imagery data
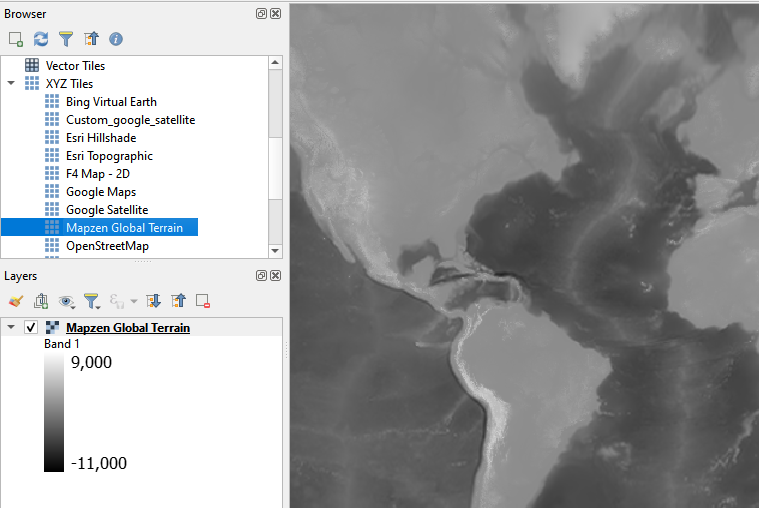
One of the easiest ways to get real-world map data is XYZ Tiles. Some of such base maps are available by default in QGIS (like OpenStreetMaps). It's important to note that other sources provide the option to download the mapping tiles in the same format. In our case, we need to get the Digital Elevation Model (DEM) tiles for the terrain and satellite imagery for texturing the terrain.
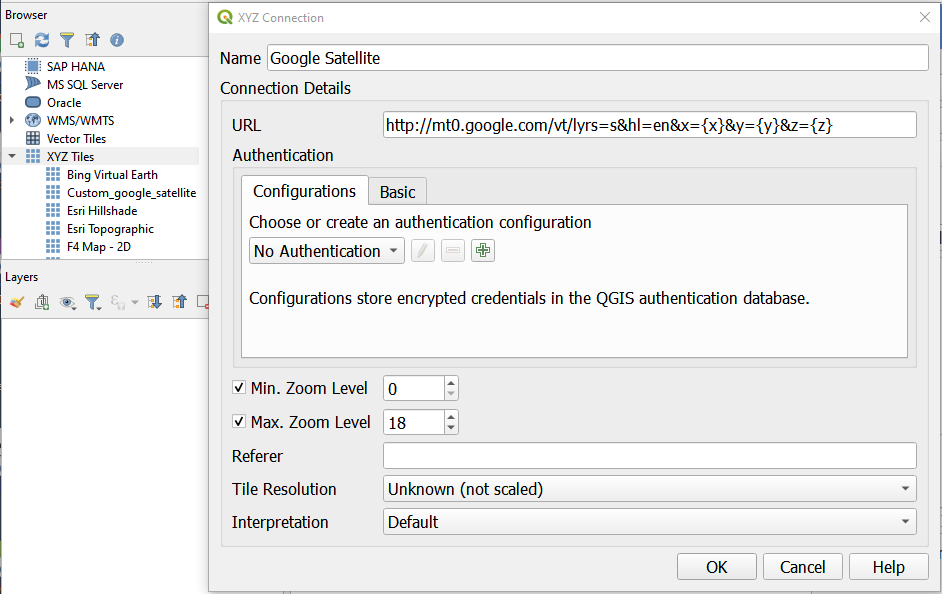
- Browser panel → XYZ Tiles→ New Connection
- Add custom name and URL:
- https://s3.amazonaws.com/elevation-tiles-prod/terrarium/{z}/{x}/{y}.png for DEM layer (more details here). Works with QGIS 3.28 onwards
- http://mt0.google.com/vt/lyrs=s&hl=en&x={x}&y={y}&z={z} for satellite images (more here)
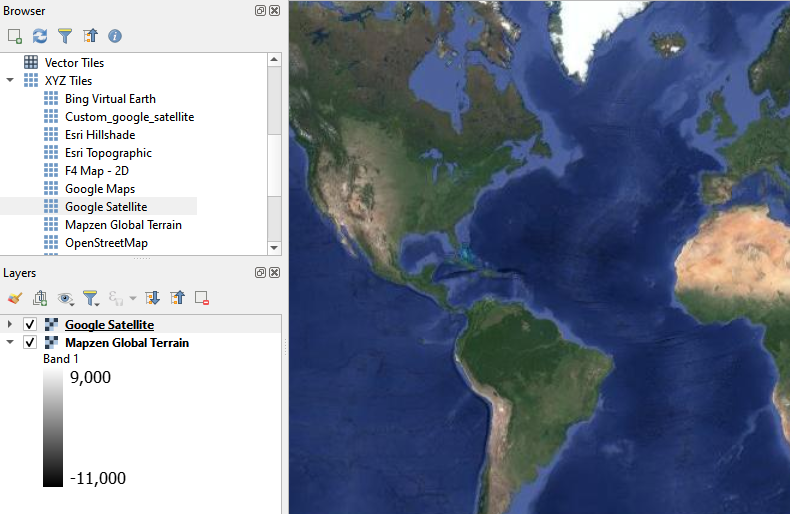
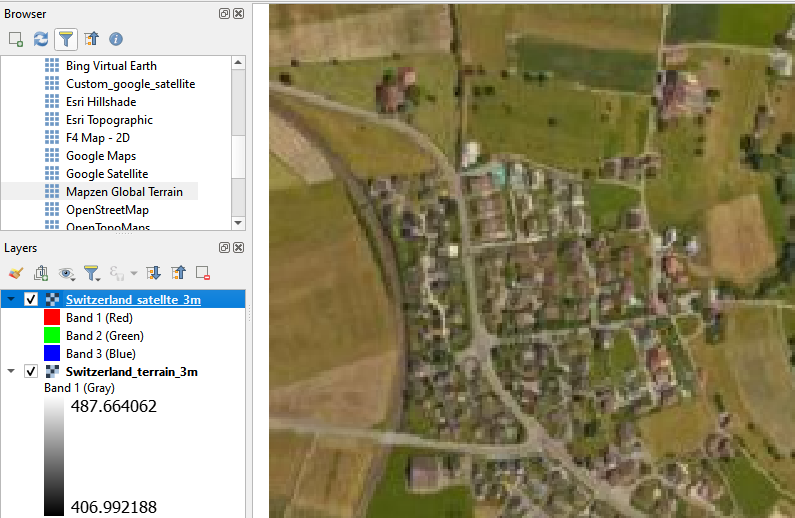
Done! Drag the tiles to the Layer panel, or simply double-click on the new connection.
Save the tiles as raster layers
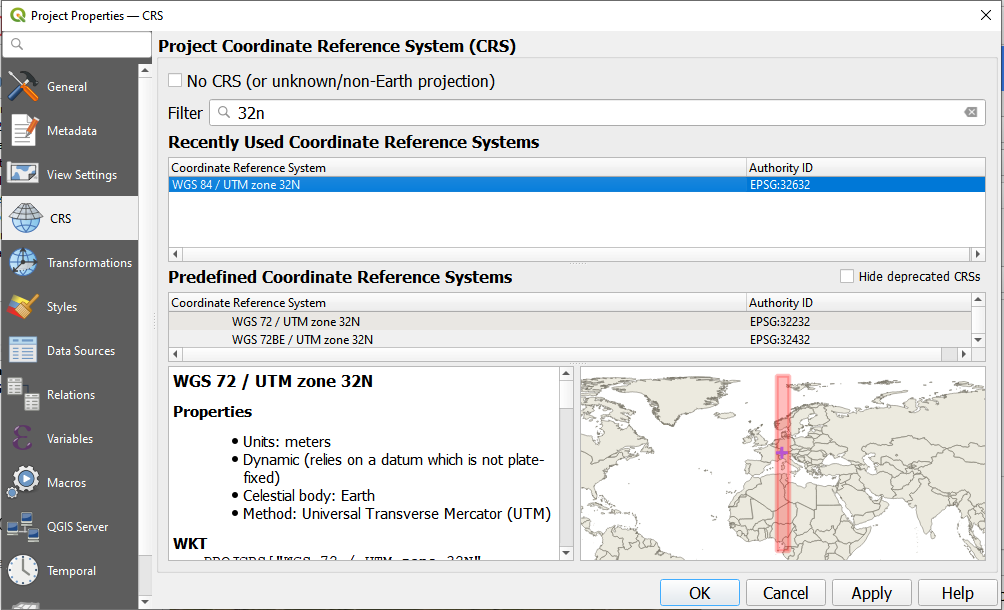
Determine the CRS that fits the best to your area: in our case, it’s a small village in Switzerland, so EPSG:32632 fits.
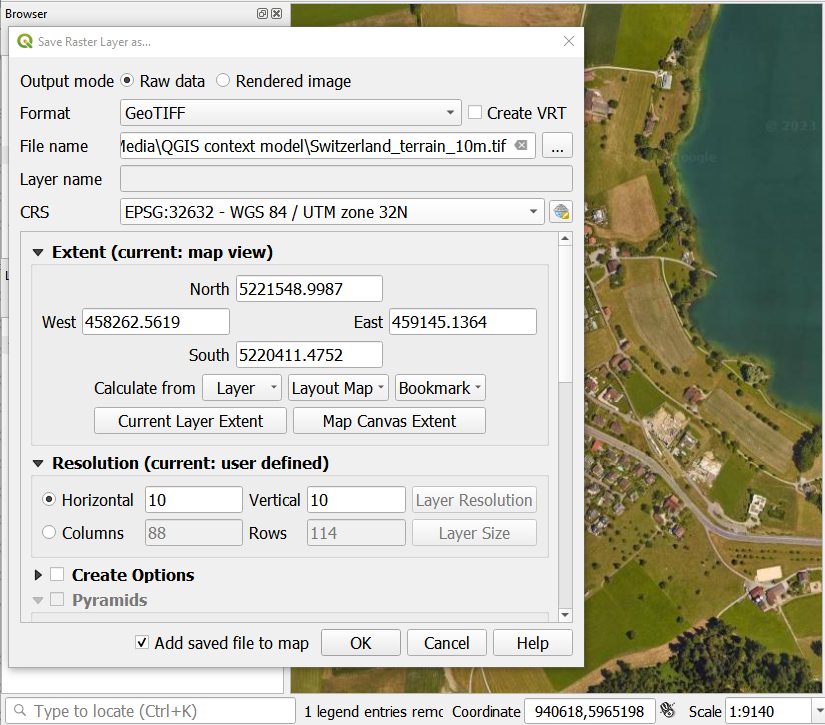
Zoom to your location. Right-click on the layer, Export→ Save As, remove the “Create VRT” checkbox, choose the desired CRS (e.g. EPSG:32632) or leave the default one, the desired extent (e.g. click on Map Canvas extent) and resolution (e.g. 10x10, or even 3x3 m - given that the chosen CRS is using meters). Repeat for both terrain and satellite layers. After saving, it will be added to your Map.
Note that choosing a higher resolution during Export (e.g. 1x1 m) will not increase the resolution of available data. The current Terrain layer does not support very detailed resolution and setting it to 1x1m during Export will just create a “Minecraft” effect when creating a 3d mesh. So keep the export resolution consistent with the data.
Prepare the settings and send the data to Speckle
First, make sure that the selected CRS corresponds to the units (linear, not geographic), and the location of your model. If the model in CAD/BIM software is located near the scene origin, the easiest way is to set the custom CRS at the location of your building. To do so, just copy the geographic coordinates of your building location right from QGIS canvas and use ‘Set as a project CRS’ function:
Normally, Speckle is sending the data from the host software in its original state. Starting with our 2.14 Release onwards, there is a new functionality called Transformations, allowing you to modify the data before sending it. One of the options in Transformations is to set one Raster Layer as a texture for another Elevation raster layer. You will need to click ‘+’ after choosing the Texture transformation and also set the DEM layer as an Elevation layer.
Click Send to send a textured terrain to Speckle.
Adding buildings
You can download building outlines for almost any location using QuickOSM plugin. It gets the OpenStreetMaps data and converts it to QGIS Vector Layers. Specify “building” in the Key field, and remove checkboxes from “Points”, “Lines” and “Multilinestrings” to get cleaner result.
This particular area doesn’t have building height information, so we can add an attribute ‘height’ with random values using Field Calculator. If there is any other field helping to identify building height, we can use it in the formula too, e.g.:
if( attribute('building:levels') IS NULL, rand(3,9), attribute('building:levels')*3 )
Add another Transformation that extrudes buildings by the value of the ‘height’ field, and projects buildings onto the selected Elevation layer. Send satellite imagery and buildings layers to Speckle.
Combine with the actual project
As we have previously selected a specific location to be a center of the custom CRS, you can safely receive the context model in your preferred software (e.g. Rhino) and have it placed correctly in relation to your project location.
If the model itself is not located at the correct altitude, you might need to drag the context model to adjust the height.
And that's pretty much it! We hope you enjoyed this short tutorial. Feel free to reach out to us in our Community Forum. We're always happy to welcome new joiners!