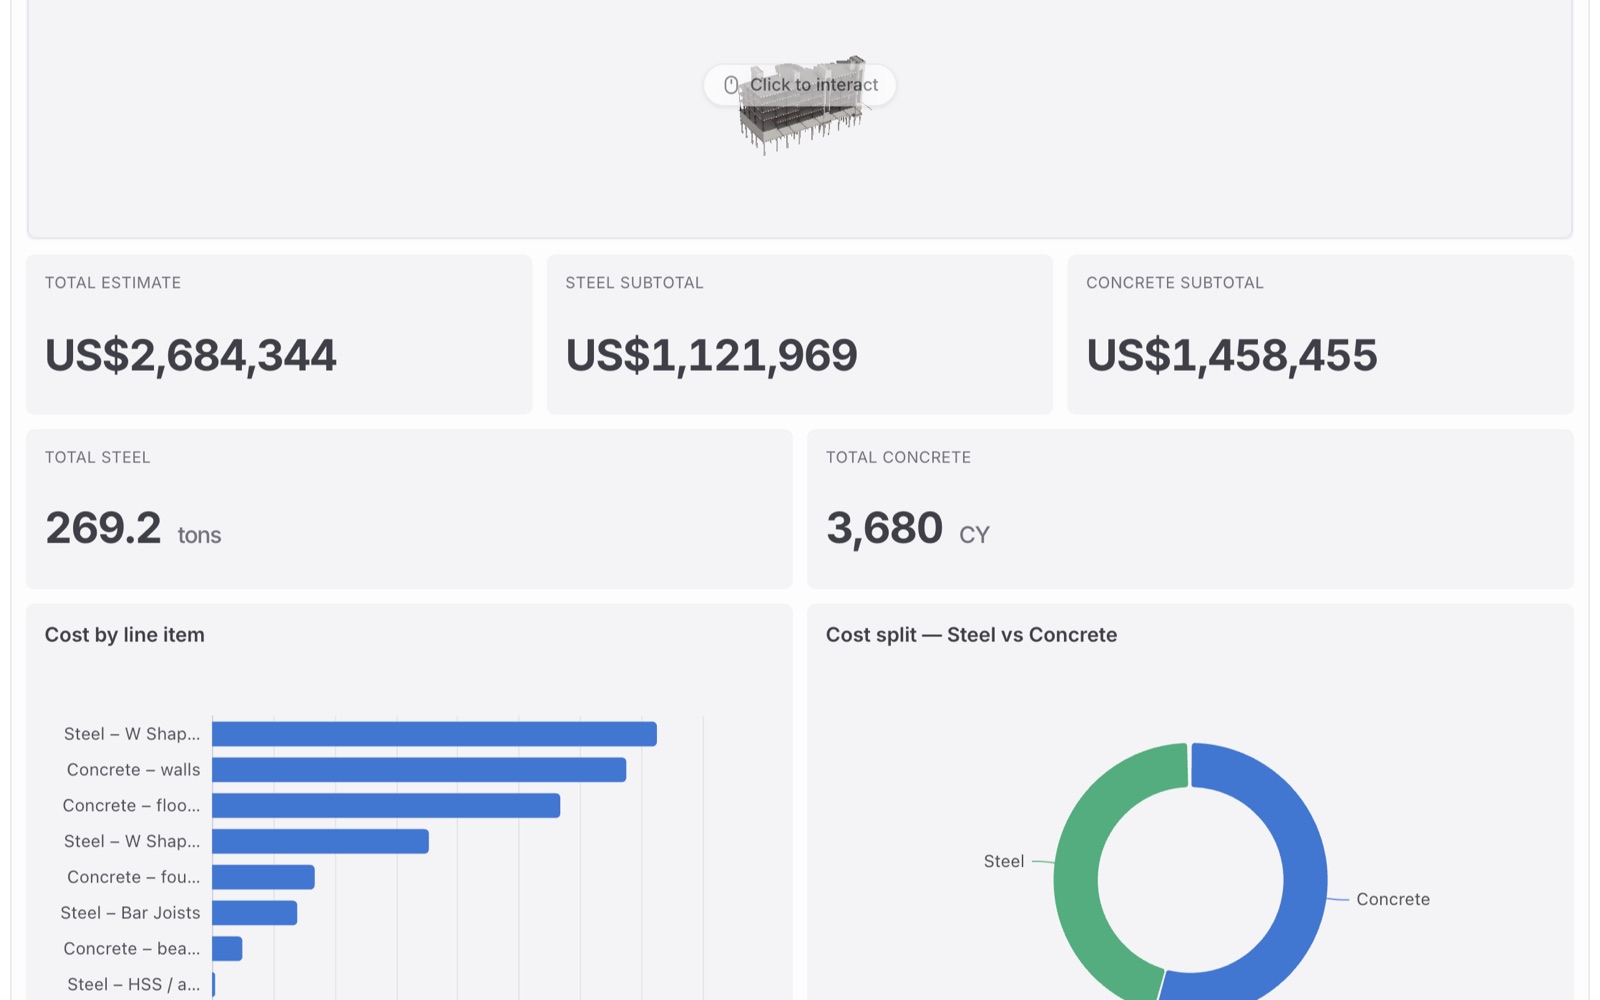
Project and portfolio status
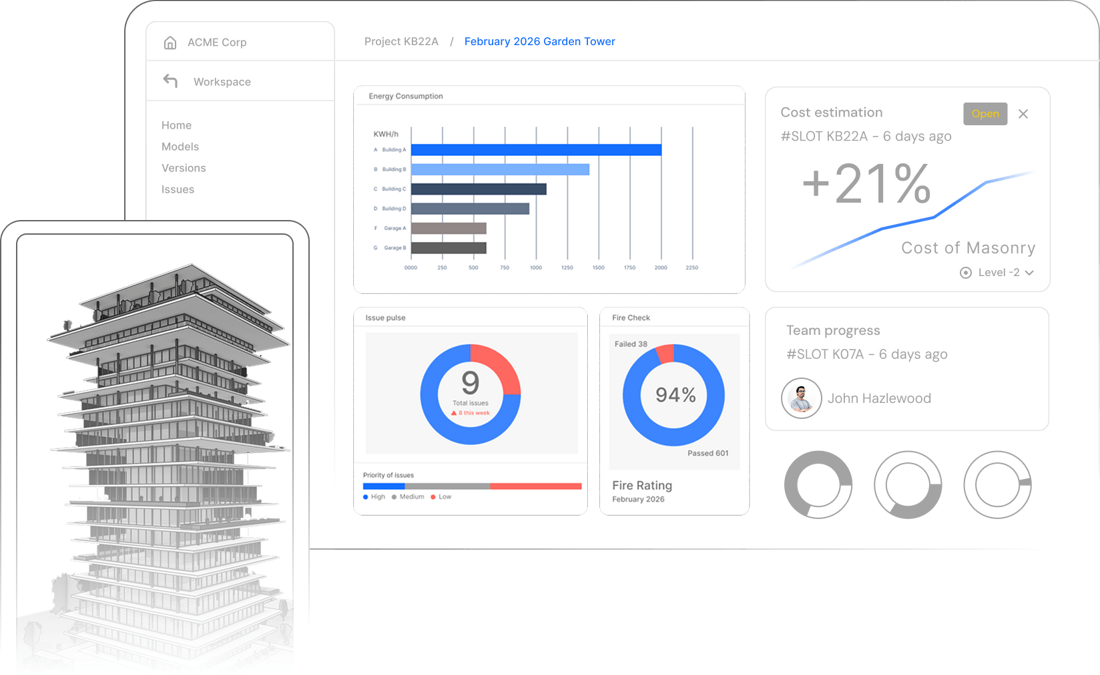
Track model metrics as projects evolve, or expose outliers in portfolio dashboards.
Model dashboards & progress tracking
Speckle connects directly to your models to give teams live visibility into quantities, scope drift, and progress without exports or lag.
Speckle Intelligence
Type what you want to know in a prompt, and Speckle Intelligence builds the report directly from your published model data. No more tedious setup or waiting on someone else to pull it together.
Save it as a report and share the link. Save the method as a skill, and every team's report uses the same rates and rules, a consistent frame across your whole portfolio instead of rebuilding from scratch.
Try a question
Speckle Intelligence
Real reports












Unify and visualize diverse model data in dashboards any stakeholder — designers, engineers, leads, clients — can view and build on, without ever opening the model themselves.
Track model metrics as projects evolve, or expose outliers in portfolio dashboards.
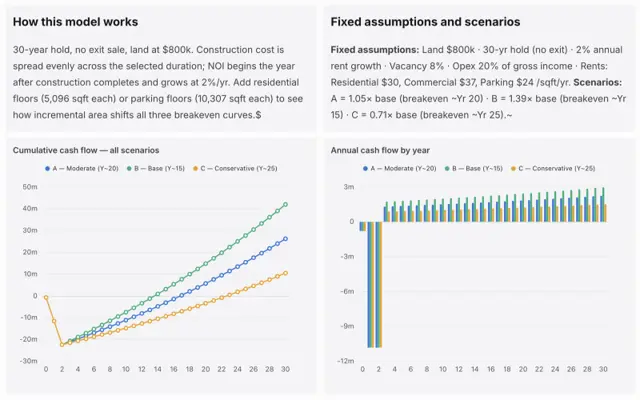
Combine cost and sustainability data to help stakeholders understand project trade-offs.
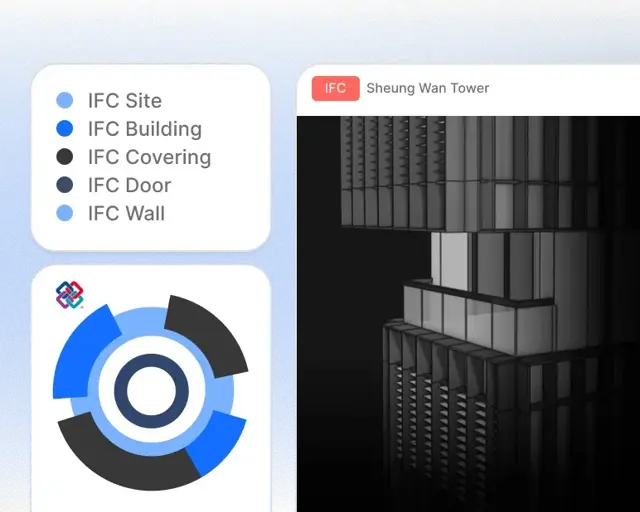
Insights from Revit, Rhino, Tekla, IFC or Forma files, accessible across the firm.
Outcomes
It used to take three people hours to create a steel tonnage report. Now anyone can do it in Speckle in minutes without having to rely on anyone else.

Matt Lewis
Associate Director

Assign responsibilities as you work and track granular team progress alongside other metrics.
Understand the differences between versions in one place to reveal risks, and design drift weeks earlier.
Validate models against project and company standards, surfacing errors on 3D models instead of spreadsheets.
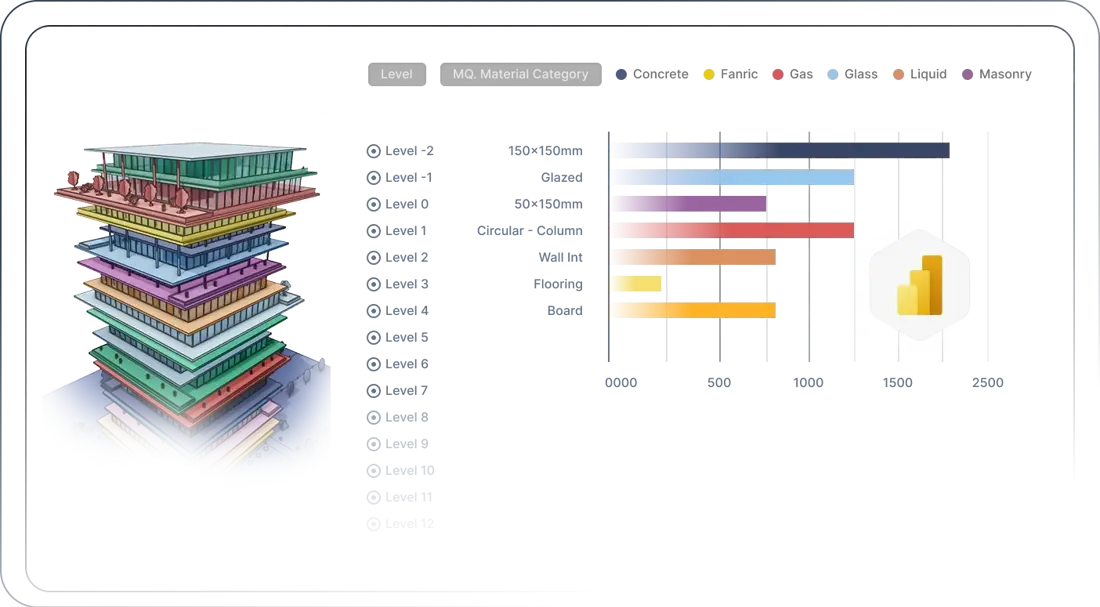
Power BI integration
Create advanced reports with a live 3D model embed, tracking progress, delivery, installation, and carbon.
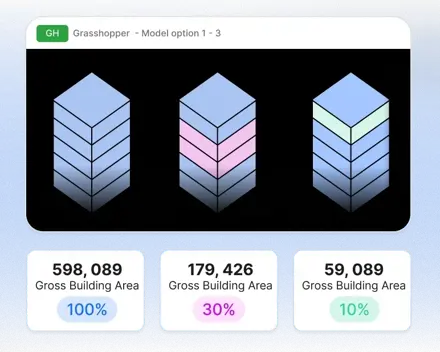
Compare three massing models created using Rhino and Grasshopper.
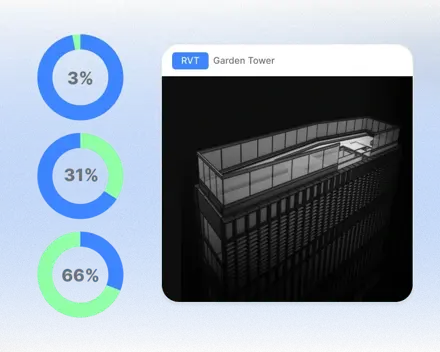
Verify whether a property inside a Revit model meets simple conditional rules.
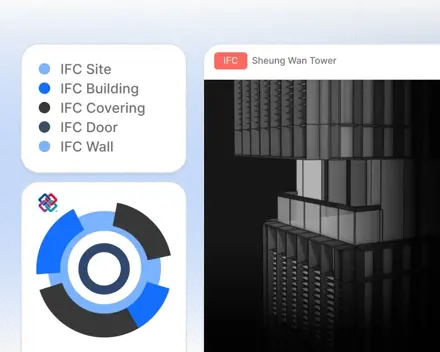
Visualize key information from your IFC model, such as IfcTypes, Building Storeys, Tags, Net Area, and more.