2026 AEC Data Survey
The State of Data Readiness in AEC - Get the Full Report
Insights from AEC professionals on data practices, infrastructure, AI adoption, and the path to measurable ROI.
Download the whitepaper
Enter your details for instant access to the full report.
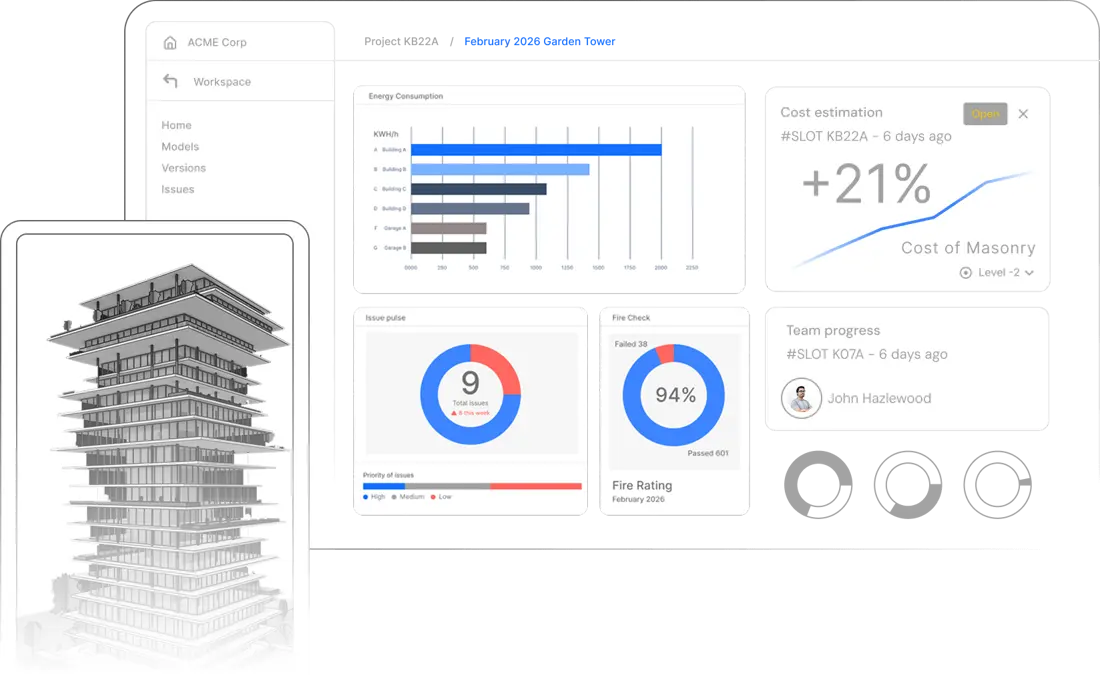












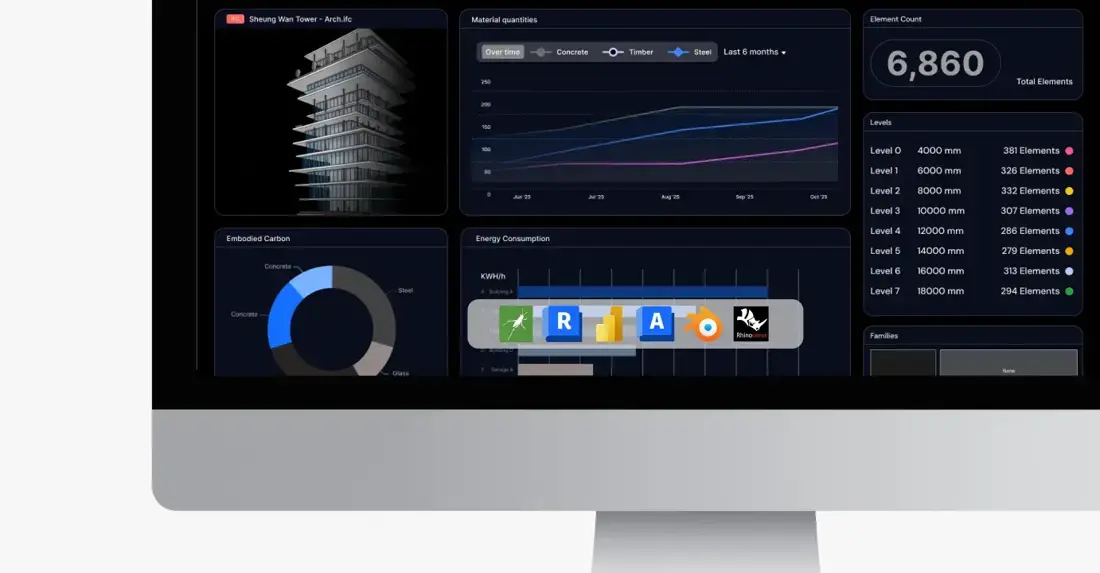
Purpose-built AEC analytics, connected to the source.
Unify and visualize diverse model data in dashboards designers, engineers, leads, and clients can easily access, understand, and trust.
Project and portfolio status
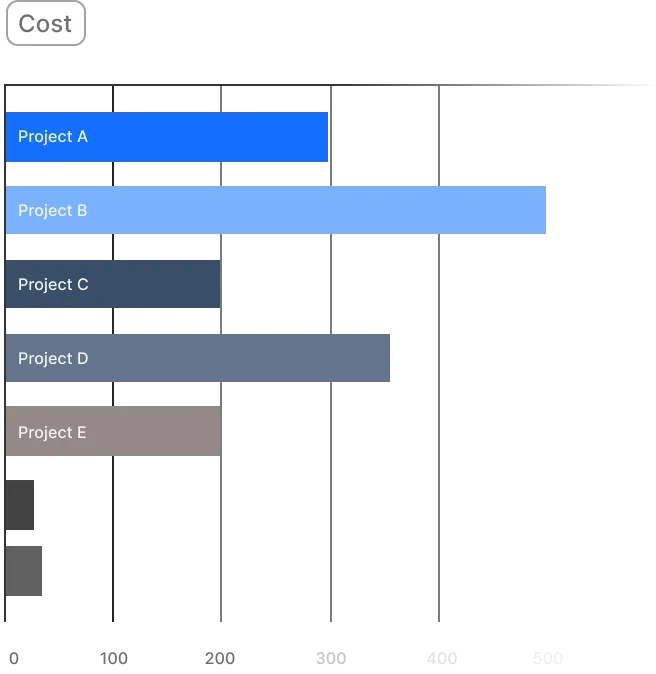
Track model metrics as projects evolve, or expose outliers in portfolio dashboards.
True price of every design option
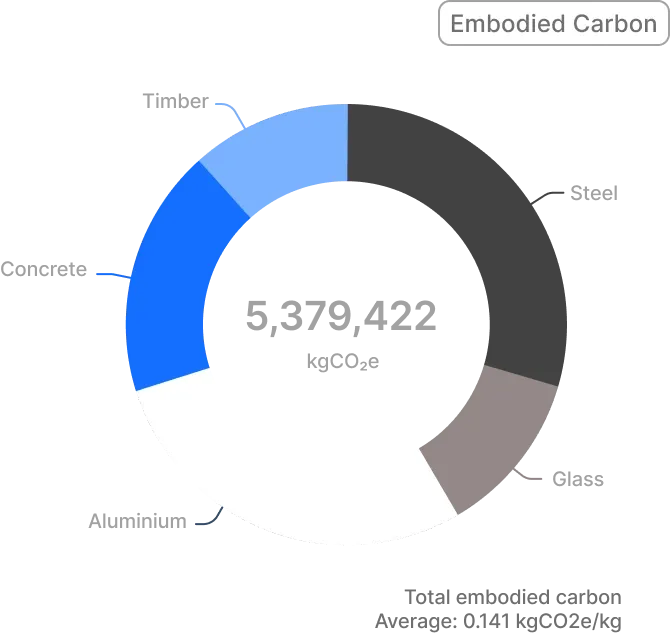
Combine cost and sustainability data to help stakeholders understand project trade-offs.
All BIM data in one place
Insights from Revit, Rhino, Tekla, IFC or Forma files, accessible across the firm.
Industry teams consistently report
5-10 hours
of rework eliminated per team, every week

30x
faster model validation

85%
faster custom analytics setup

98%
reduction in reporting cycles

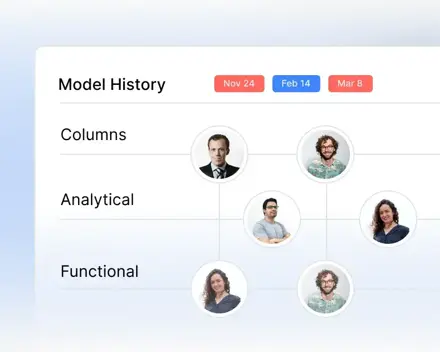
Faster project coordination
Assign responsibilities as you work and track granular team progress alongside other metrics.
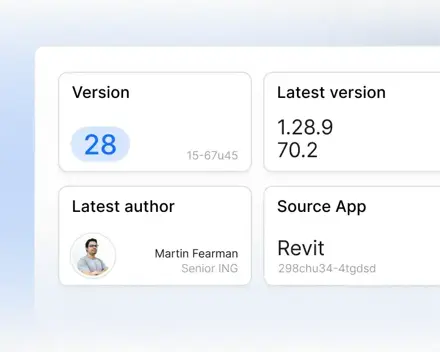
Powerful change control
Understand the differences between versions in one place to reveal risks, and design drift weeks earlier.
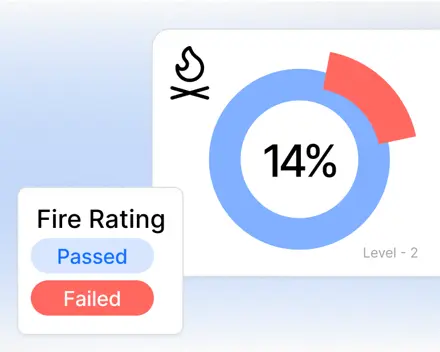
Catch issues early
Validate models against project and company standards, surfacing errors on 3D models instead of spreadsheet.
Speckle Intelligence
Instant dashboards from any model data
Customize reports from 3D data in minutes. Share with stakeholders, validate decisions faster and eliminate manual reporting.
Learn more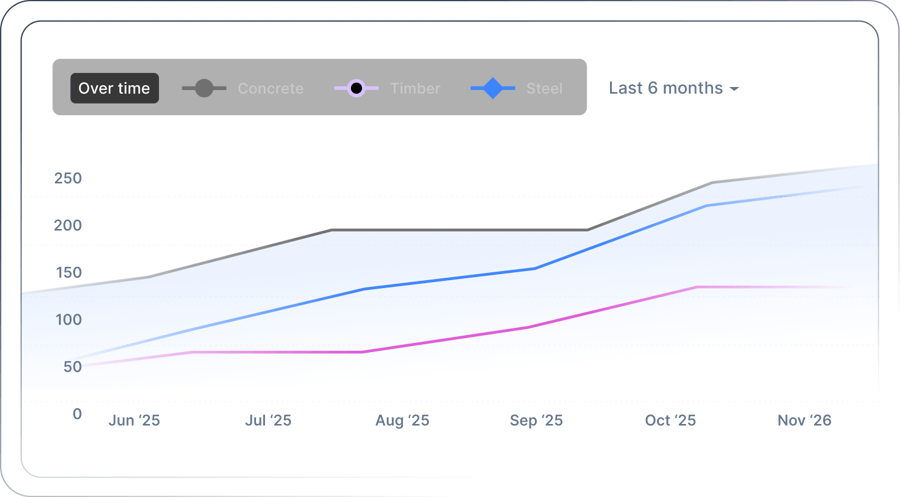
Power BI integration
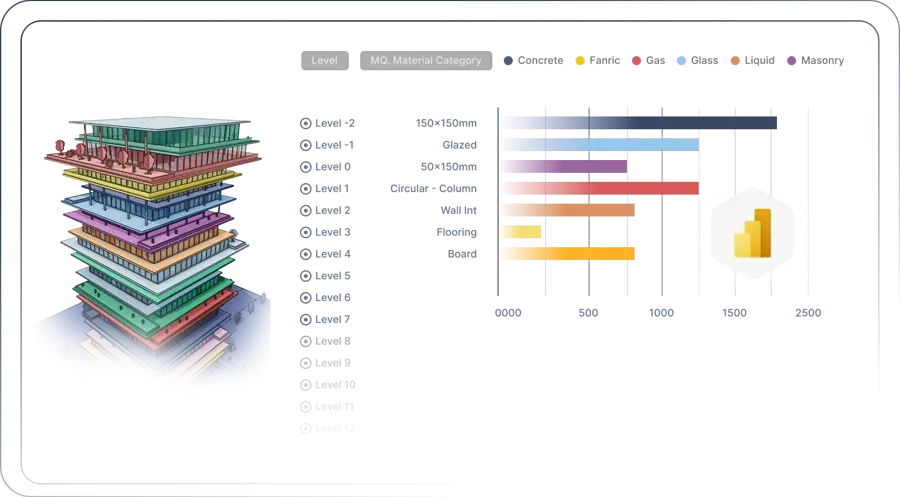
Deep BIM analytics with Power BI
Create advanced reports with a live 3D model embed, tracking progress, delivery, installation, and carbon.
Start integrating