Zutari automated report writing with Speckle
Company
Zutari is an infrastructure engineering and advisory practice delivering large, complex projects around the world. They work with a digital-first mindset and run a Global Design Center (GDC) that handles everything from football stadiums in Australia to mega towers in Dubai.
Challenge
Zutari had just two months to complete a structural design review that had originally taken the previous consultant six years. Let this sink in!
The project involved a suspended roadway structure so complex it was described as “like the Eiffel Tower turned sideways and hanging in the air.” It consisted of 70,000 individual elements and stretched 400 meters long by 200 meters wide.
Beyond the time pressure, the team was drowning in data chaos. The existing workflow produced an overwhelming number of model versions, calculation files, and reports.
File management was a constant headache—links broke when files were moved between machines, version control was out of control, and finding the right place to save or name a file took more time than it should have.
Extracting data from the structural analysis software was a delicate process, full of filters and parameters, where one wrong click could produce an inaccurate report.
Excel quickly hit its row limits, forcing data to be split into multiple files. And because collaboration was so difficult, much of the work had to be done by one person, defeating the purpose of having a team.
Solution
Zutari knew their current methods wouldn’t cut it. They needed a way to handle complexity without getting lost in it. They turned to Speckle, not to add another tool to the stack, but to boost the existing stack with a faster and simpler solution.
Speckle became the one place to send and store their models, track versions, and centralize the entire flow of data.
Instead of relying on manual file management, they used Speckle Automate to run Python scripts that sorted and classified elements automatically, based on direction and position. That alone saved hours.
Reports were generated from clean, consistent data sent into Excel directly from Speckle, with no need for endless file exports—everyone had access to the same live data.
So here we can see how the data stored in multiple places as different objects—such as Excel files, model files, and on SharePoint—makes it difficult to collaborate, and also to automate this workflow. And that's why we turned to Speckle—not just because I'm a fanboy, but also because we could use it as our central data storage as well as a platform to host the automations that we were developing.

James Abrey

How they did it
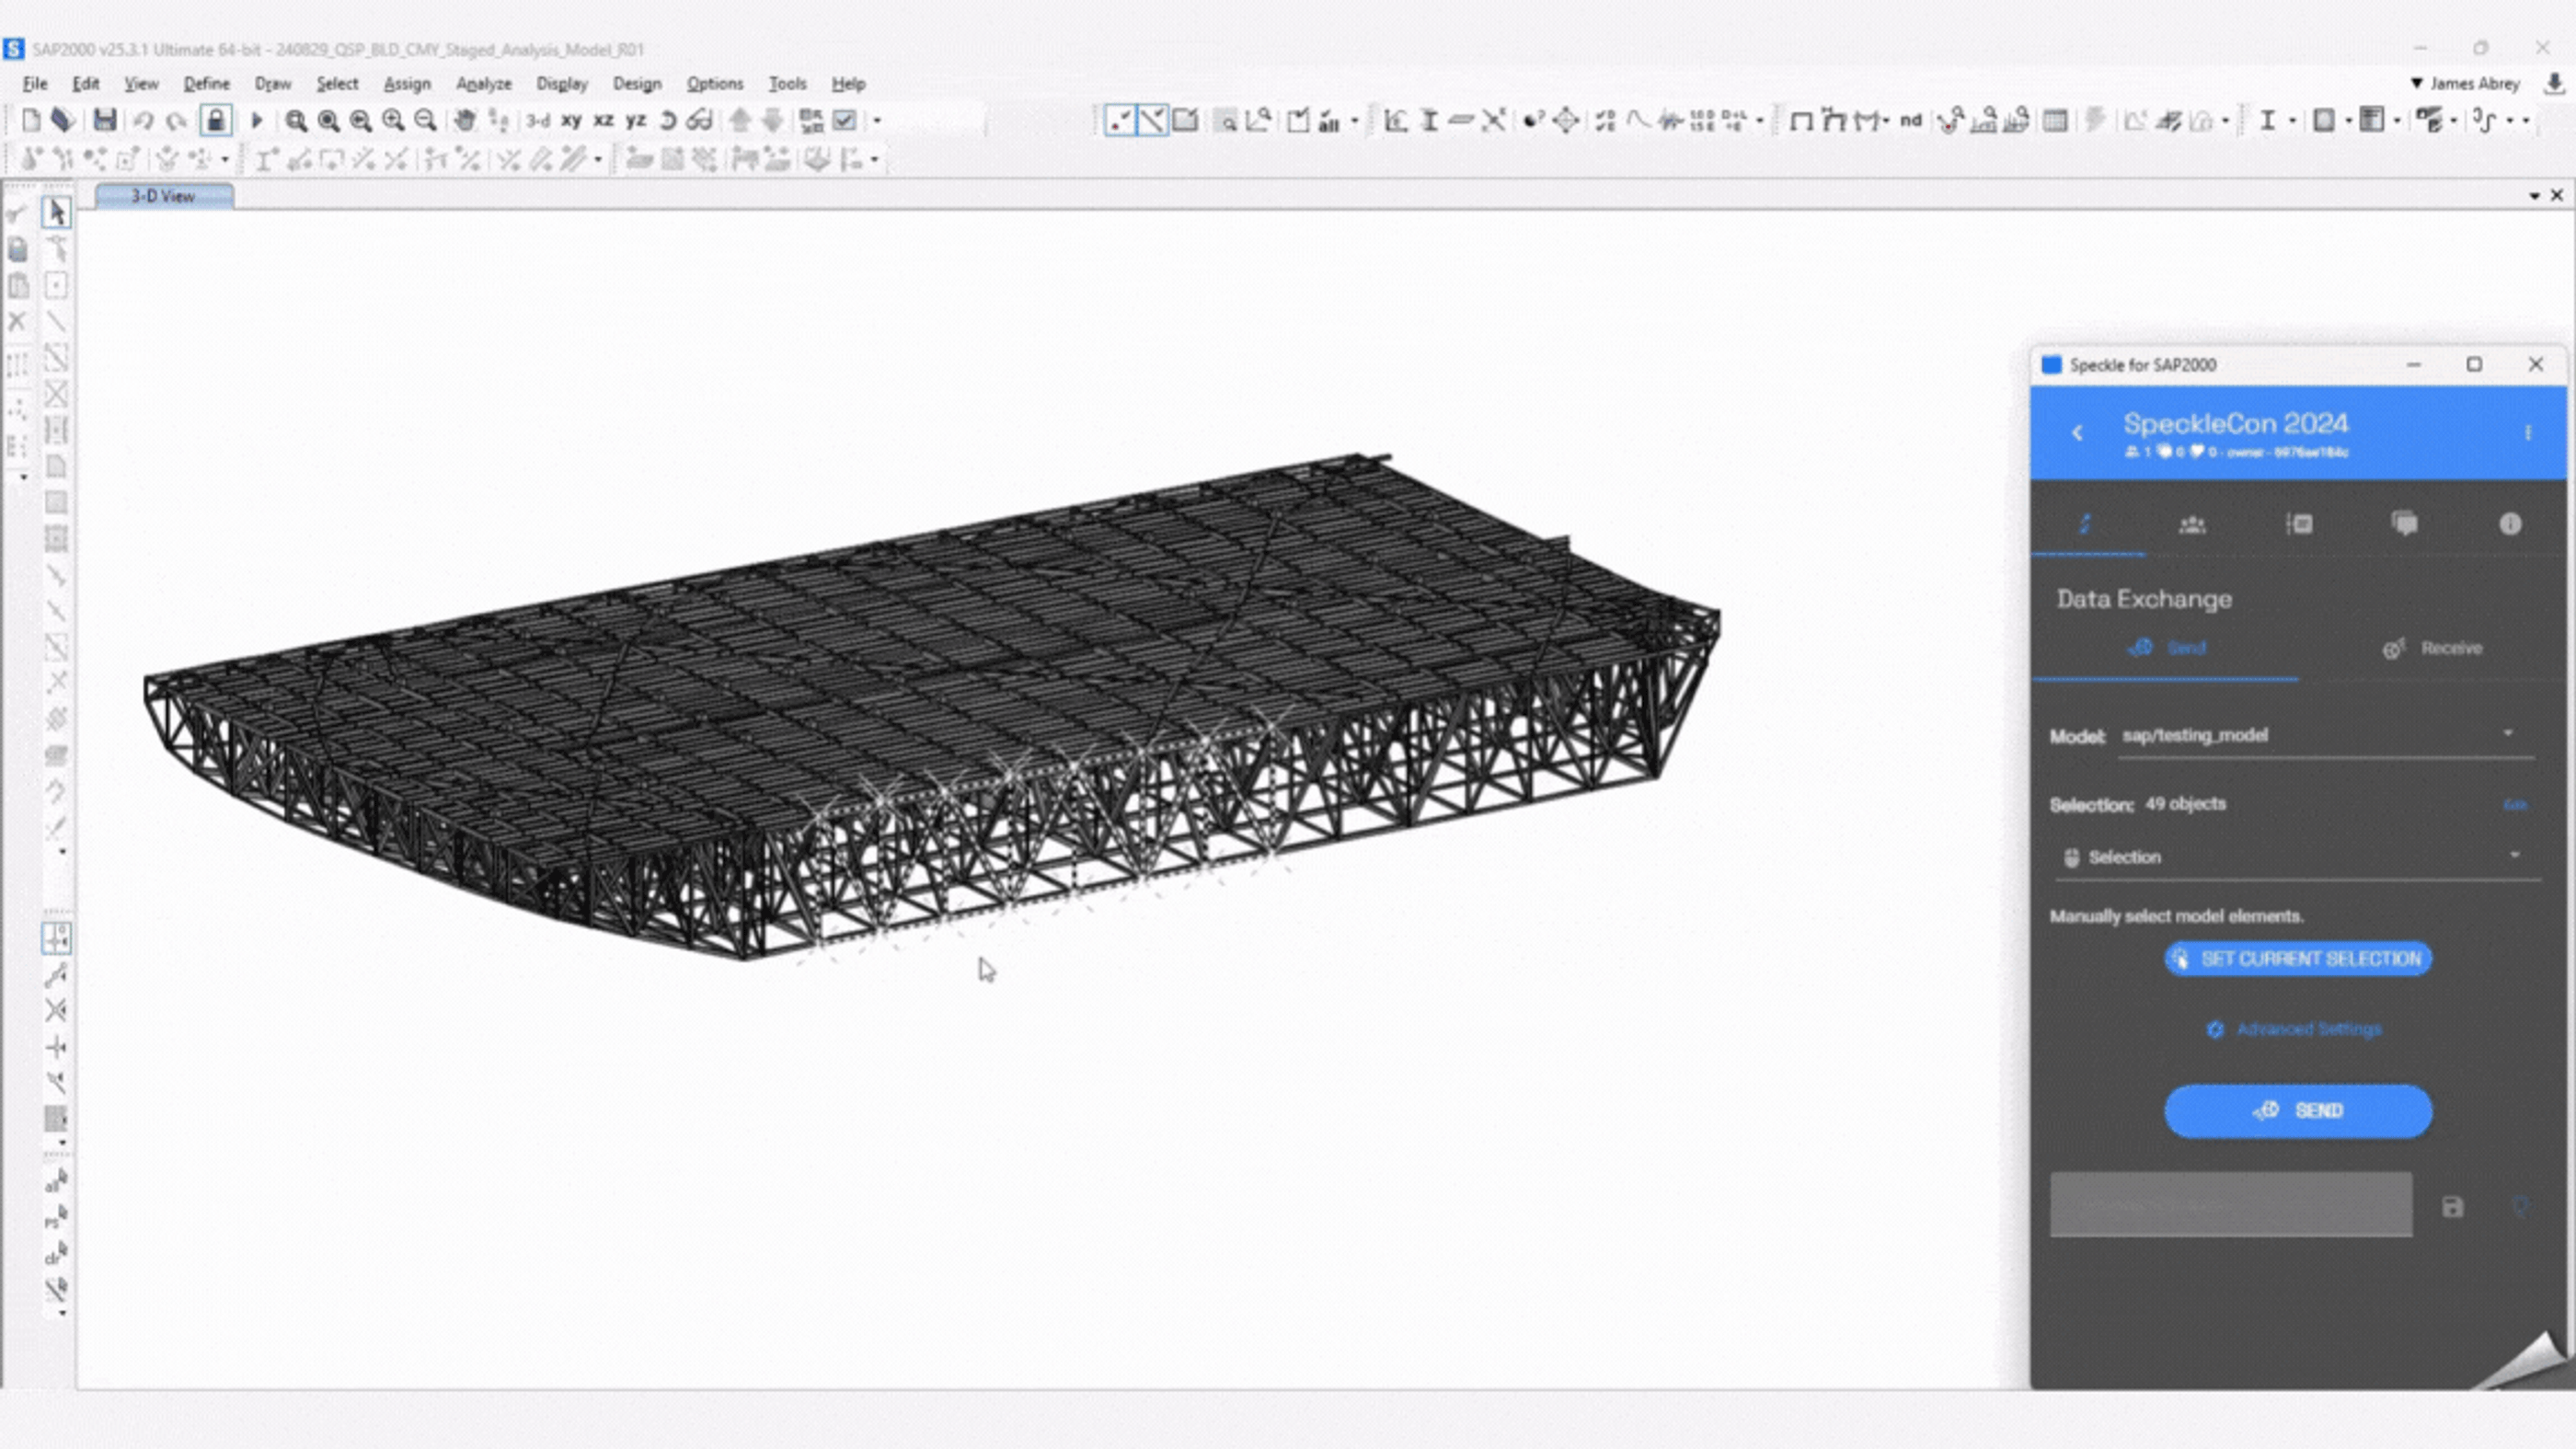
The team exported their structural model from SAP2000 and sent it to Speckle using the legacy connector. From there, they ran scripts via Speckle Automate to classify the model’s 70,000 elements. That data flowed into Excel using another connector, where it was filtered and used for report writing.

They kept all their Python scripts on GitHub, so everything was versioned and easy to share. The team could always see what had changed and who had changed it. James, the computational designer leading the implementation, was already familiar with Speckle and brought in workflows he’d previously developed.
That made onboarding smoother for everyone else. New team members could instantly access the project history and the latest model—no hunting for the right file, no guessing.
The Zutari team began by sending their structural analysis model to Speckle using the connector. This one-time setup allowed future updates to flow without reconfiguration. Initially, the model in the Speckle Viewer showed unclassified 1D line elements, streamlining the data extraction process.
They then used Speckle’s Automate function to classify elements automatically. A Python script analyzed each element’s orientation and assigned a classification—vertical, diagonal, or horizontal. The model was updated with 3D geometry and classification parameters, enabling side-by-side comparison with the original version.
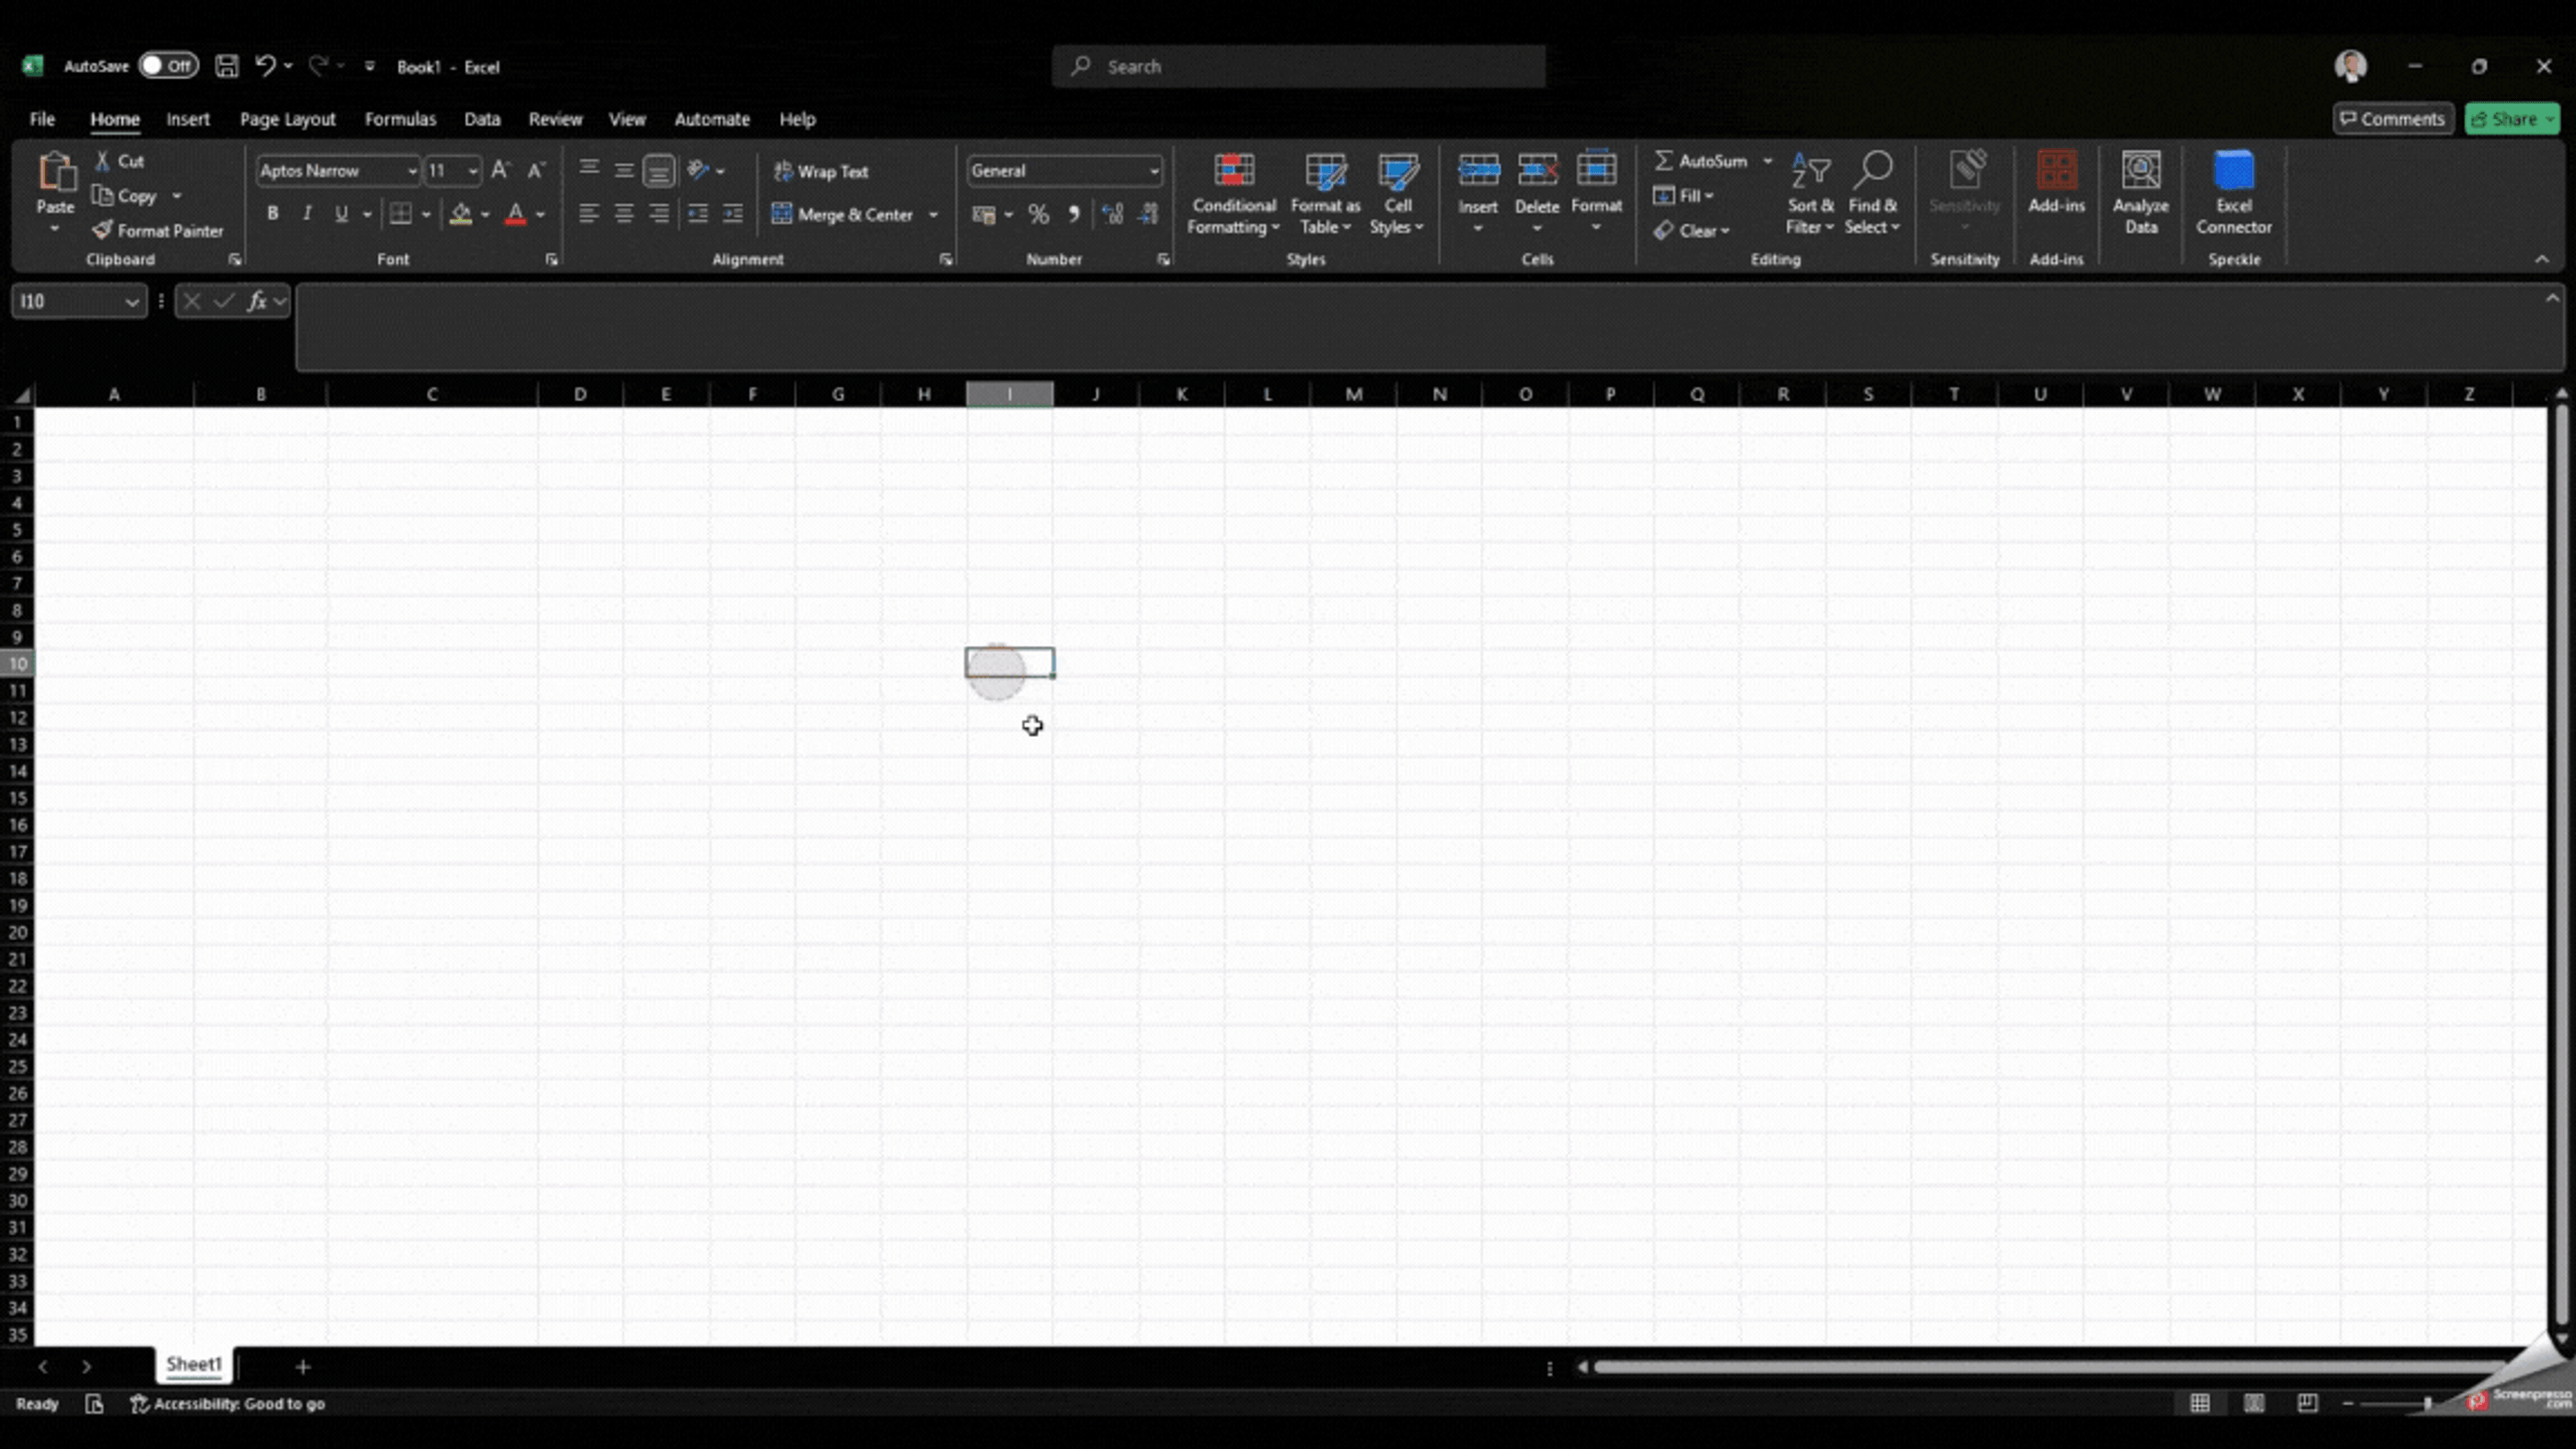
Next, the team pulled just the necessary parameters—element name and classification—into Excel using the Speckle (legacy) connector. This eliminated the need for large, manually managed spreadsheets and allowed all team members to access the latest data directly.
The final deliverables included automated 3D visuals and Excel charts, which were used in reports to clearly link structural elements with their performance data. The team also planned to embed the Speckle viewer into Power BI to further enhance client communication.

Results
- 96.7% time saved compared to previous consultants
Zutari managed to do in two months what had previously taken six years. Automation cut hours of manual work down to minutes.
- Less rework and better data
The endless rework cycle disappeared. Reports were more accurate, collaboration was easier, and the whole workflow finally felt under control.
With fewer files, fewer mistakes, and fewer surprises, the team could spend more time doing actual engineering work and less time pushing data.
Future
This experience pushed Zutari even further in their digital transformation. With Speckle now deeply embedded in their workflows, they're moving toward a more model-driven, automated way of working—not just for this project, but across the board.
In the future, they plan to explore the integration Speckle has with even more construction industry tools, such as Power BI, to enhance model data visualization and reporting.
Create tailored workflows to save precious time.


