

Overview
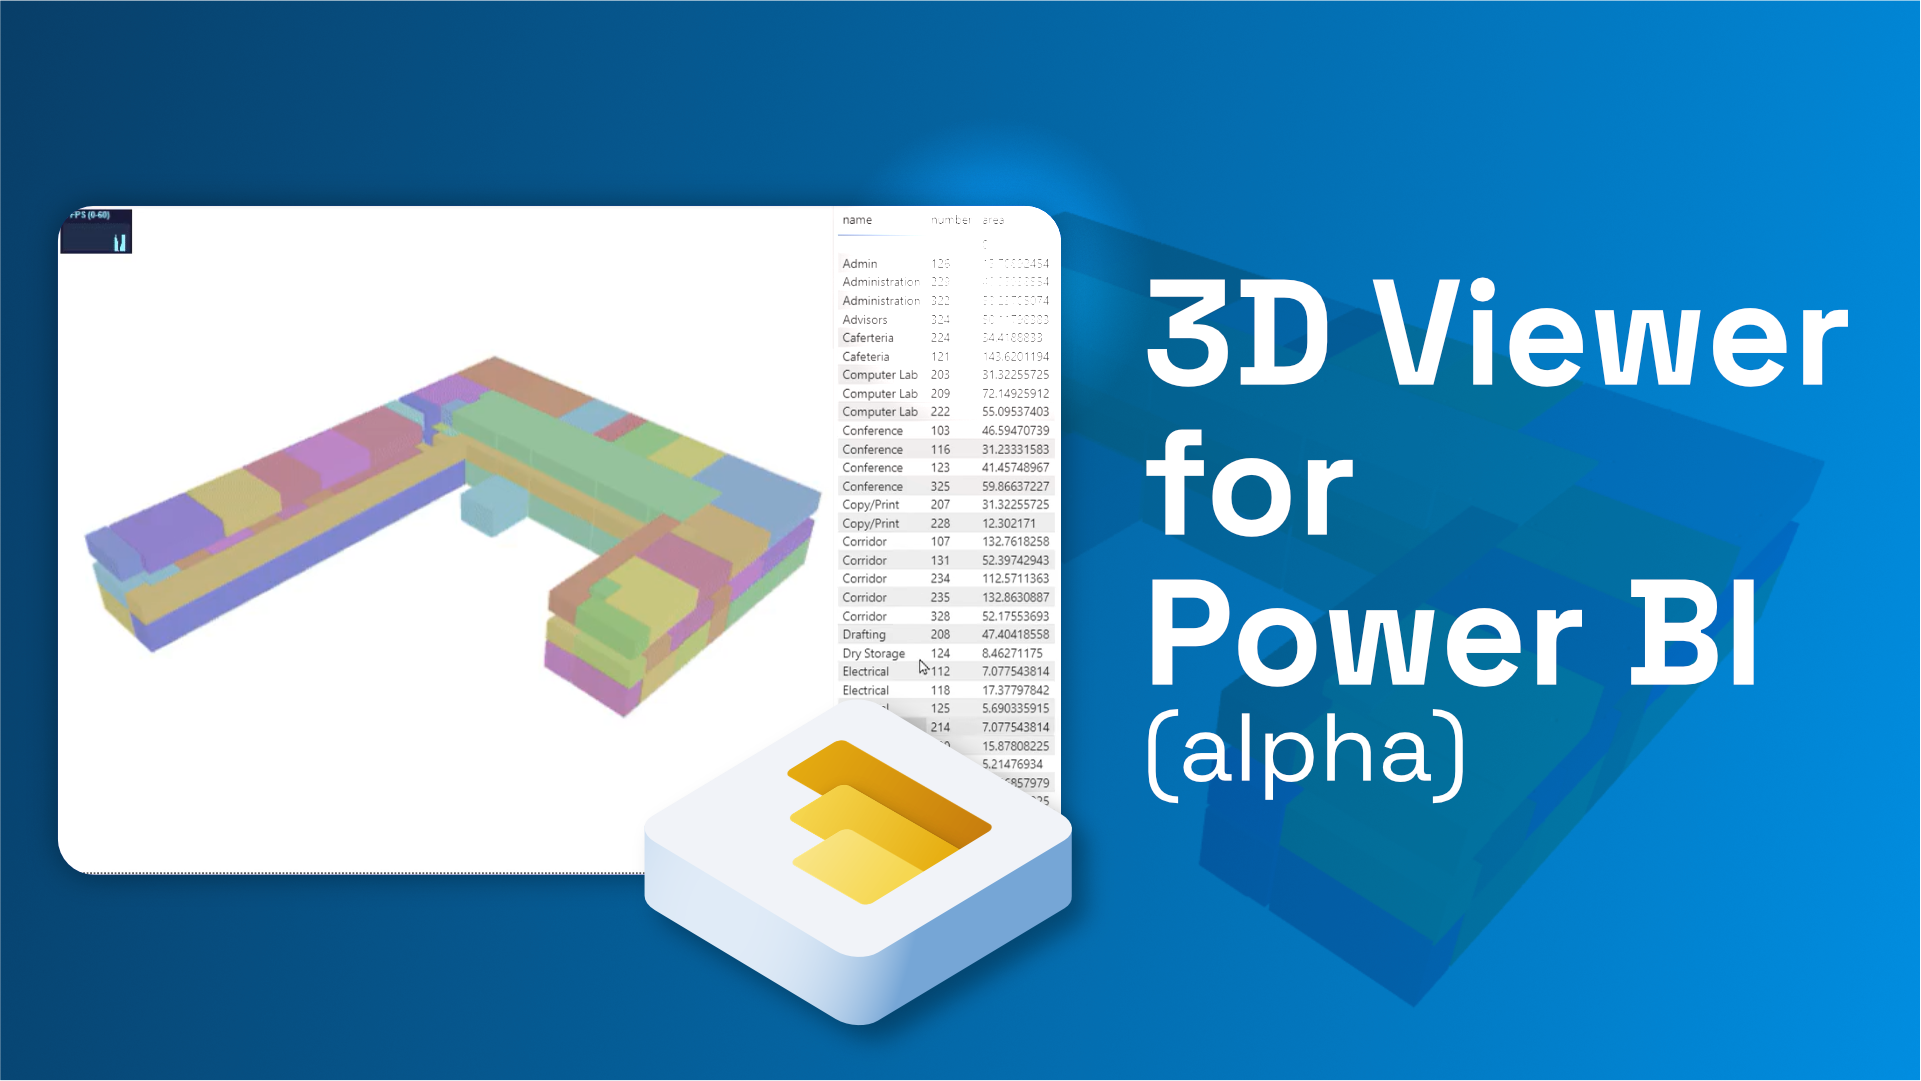
The 3D Viewer Visual allows for the visualization of Speckle data in a 3D environment inside your Power BI reports. It is compatible with Power BI Desktop and can also be used in PowerBI.com for online visualization.
::: tip
The Power BI visual is still in early stages of development. We welcome your feedback!
:::
Features
The current version enables basic visualization, filtering and coloring features, as well as some basic camera and color controls:
- Load individual objects that were fetched with the Power BI Data Connector
- Highlight objects in the 3D viewer that were selected on a different table in the report.
- Color objects based on a category or value
Installation
You can install the Speckle 3D Viewer Visual manually by following these steps:
- Download the latest
.pbivizpackage from our Github repo (opens new window). - Open your report in Power BI Desktop or Power BI service.
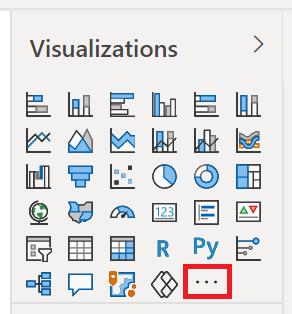
- Select the ellipsis from the visualizations pane.
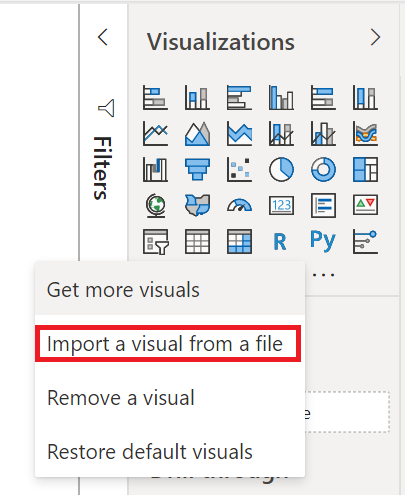
- Select
Import a visual from a filefrom the menu.
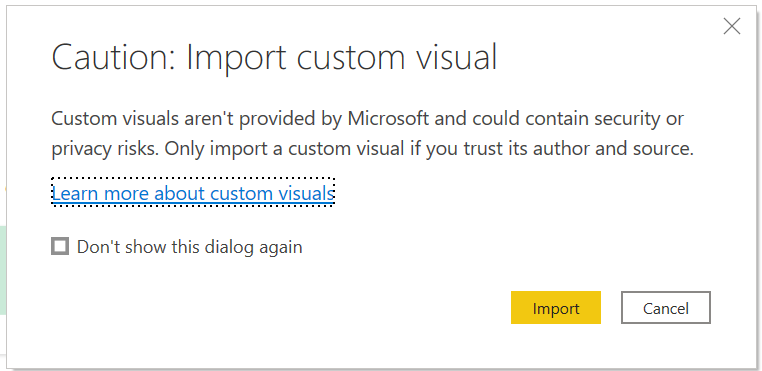
- If you get a message cautioning you about importing custom files, select
Importif you trust the source of the file.
- Navigate to the folder that has the custom visual file (
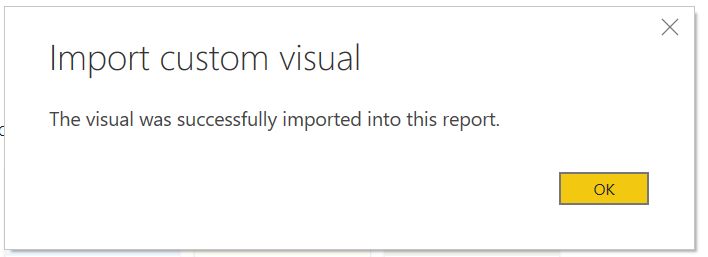
.pbiviz) and open it. - When the visual has successfully imported, select
OK.
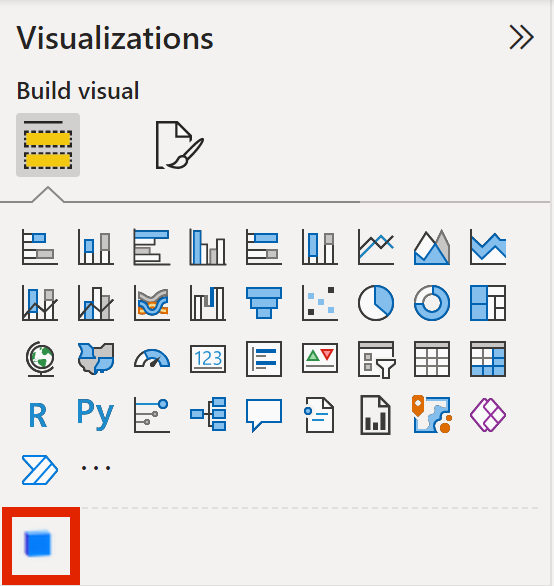
- The visual now appears as a new icon in the visualizations pane of the current report. Select it to create the visual on the report canvas.
::: tip
If you want the visual to remain on the visualization pane so you can use it in future reports, right-click on it and select Pin to visualization pane.
:::
Usage
The 3D Viewer Visual was designed to work alongside our Power BI Data Connector (version 0.10 or above). The data connector will output a table containing the following columns:
data: A column of records containing the data belonging to each speckle object.Stream URL: The stream URL this object was fetched fromObject ID: The id of each speckle object in the table (this was extracted from thedatarecords).
Other columns may be present, and can be user generated, but are not relevant for this section.
Loading objects
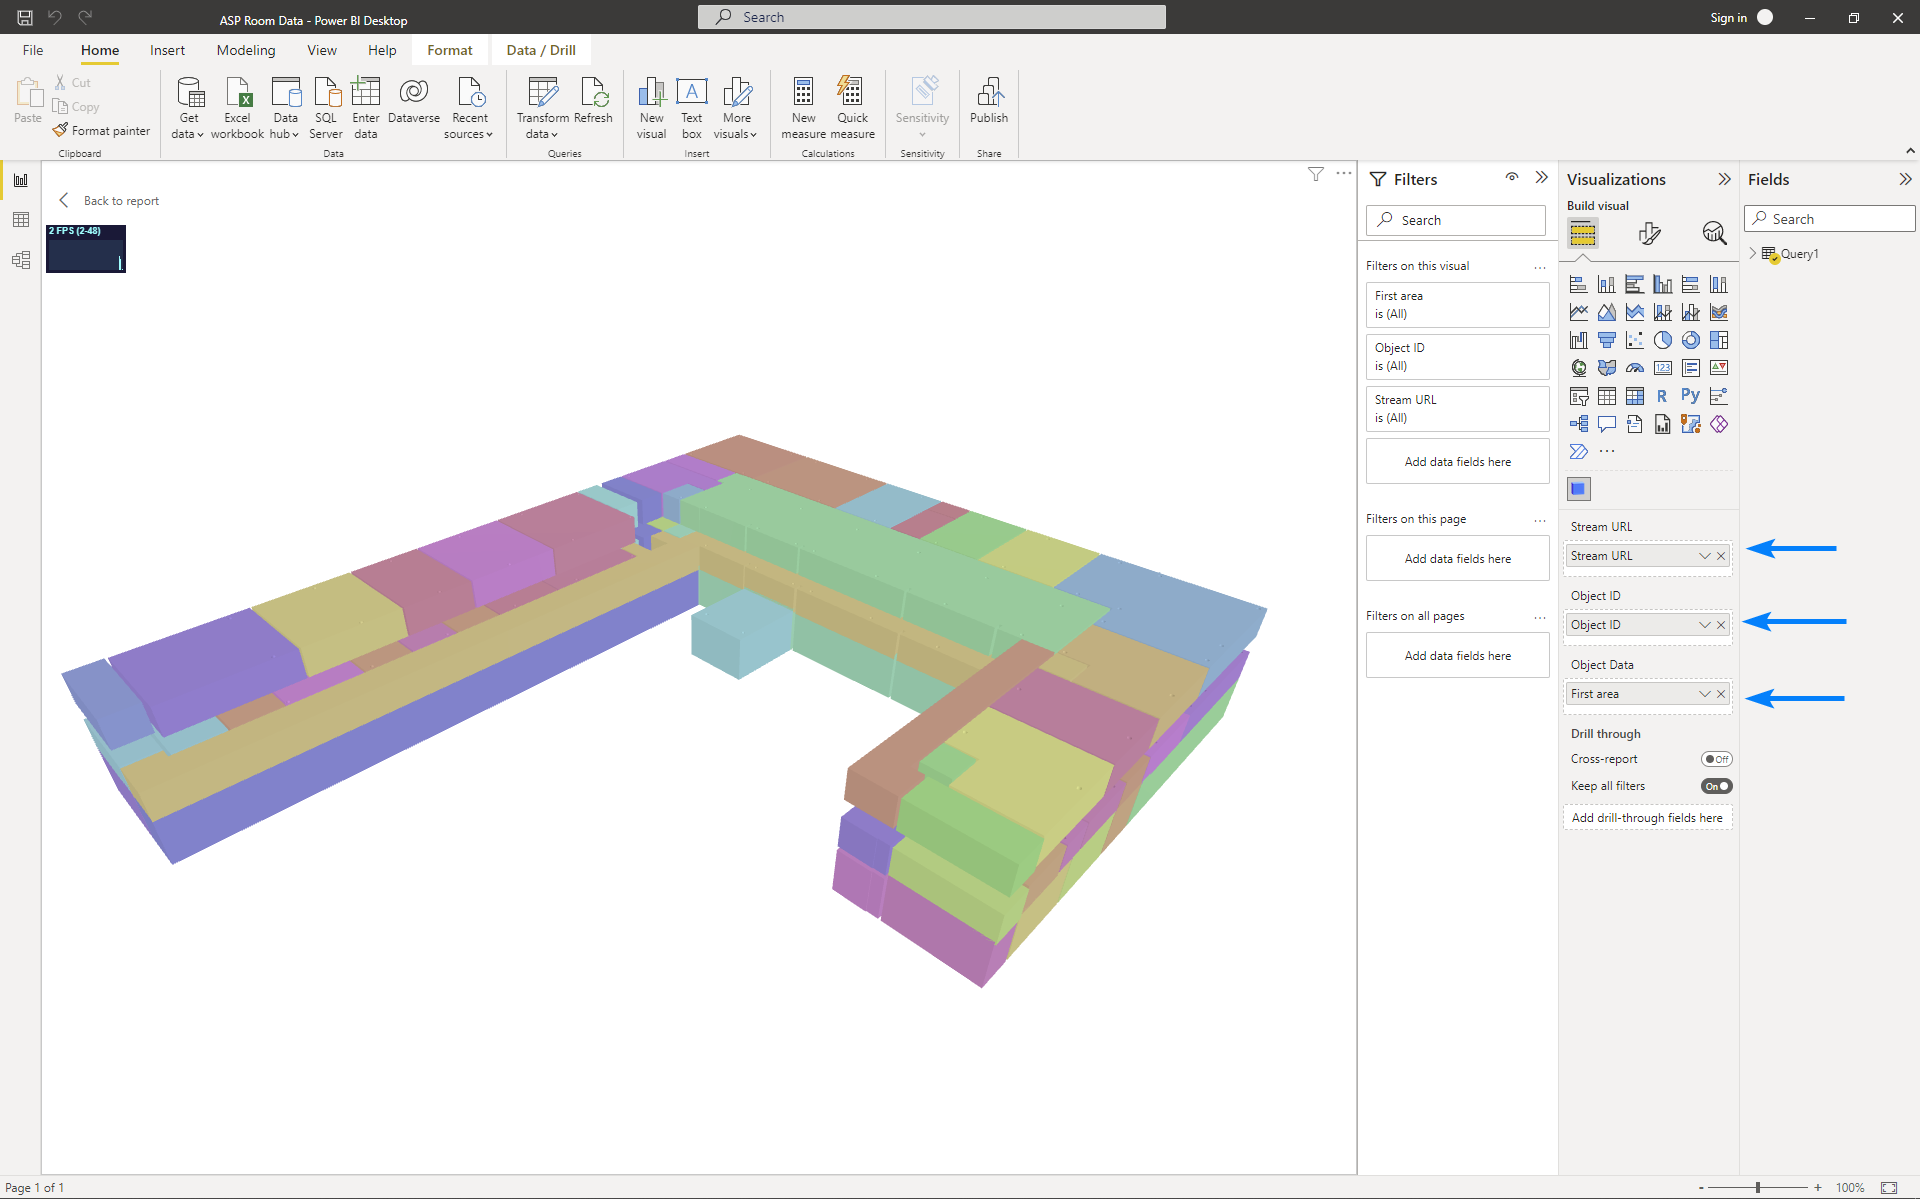
In order to load the objects from the table into the viewer, just add the fields Stream URL and Object ID onto their respective inputs in the visual.
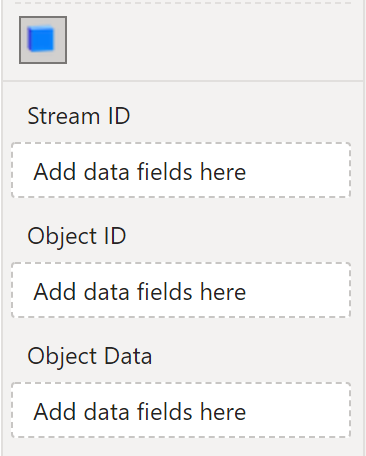
Once both the fields are added, the Viewer would start to load the objects into the scene. The Object Data input is optional, and is only used to enable highlight/coloring functions.
Highlighting objects across visuals
In order to enable highlighting across report visuals, connect a field on the Object Data. This could be any field in your data source (the object id, volume, level name, beam type...)
Once a field has been added, any objects highlighted in another visual (such as a Table, Matrix, Slicer...) will be filtered out in the viewer, showing any other objects ghosted out (gray transparent material).
Coloring objects by parameter
Coloring objects works in the same way that highlighting. Once a field has been added to Object Data the viewer will color the data by the field that was provided, when available.
The way an object is colored depends on the type of field you connected:
- Text based fields: The colors will be automatically generated by unique value.
- Number based fields: The colors will be generated using the 3-color gradient in the Viewer Settings, assuming the first color represents the minimum value and the last color represents the maximum value.
Visual Settings
Camera controls
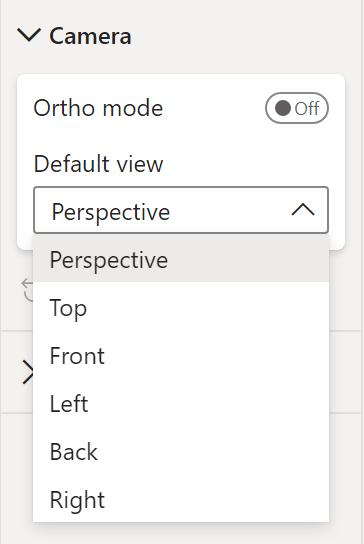
The camera controls settings allow for:
- Orthogonal or perspective mode
- Setting the view that would be shown when first loaded (top, front, back, left, right)
Colors
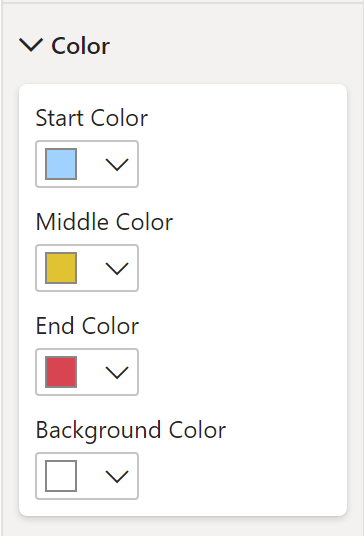
The filtering/coloring feature available when connecting a data field into the Object Data section can be customized by selecting a 3-color gradient on the visual settings.
This will affect the color palette that is used when coloring objects by a number based field. When connecting a text based field into the Object Data input, the color will be computed automatically and the color pallette in the settings will be ignored.
Feedback
We're really interested in your feedback regarding the integration between Power BI and Speckle! You can always reach us with suggestions, comments, and error reports on our Community Forum
Curious about Speckle?
🚀 Give it a try!
- Getting Started → https://speckle.systems/getstarted/
- Community → https://speckle.community
- Docs → https://speckle.guide