Already on the verge of signing up? Do it now, read later!
The Role of Data in AEC
AEC firms store 2.5x more data than industries such as real estate, retail, manufacturing, and life science. That’s almost 150% more data to manage, store, and manipulate. From hyper-accurate BIM models to entire cities designed digitally.
The information produced can influence different touch points of a product lifecycle, making it necessary to leverage tools that turn these data points into strategic insights.
BIM (and CAD) models are essentially huge databases, and being able to strategically leverage that information is key to driving efficiencies, data democratisation, and productivity. This is where Business Intelligence (BI) comes into play.
Business Intelligence: Harnessing the Power of Data
The rise of Business Intelligence solutions in the AEC led to impactful use cases such as energy sufficiency and sustainability analyses, building performance evaluations, and resource allocation optimisations. These applications are a testament to the fact that there is still room for innovation in AEC, by thinking outside of the box and harnessing a “next-gen innovation mindset” to drive the industry forward.
Speckle, as AEC’s collaborative data hub, plays a key role in enabling this shift to happen. This is what Beyond the Speckleverse aims to achieve: inspire you to come up with ingenious solutions to introduce powerful data management use cases that promote better ways of working in AEC.
Inspiring Ways of Leveraging Data with Speckle
“Speckle allows you to actually take action over how you can flow data through your workflow. This opens opportunities to use data that enables more collaboration and coordination,” says Jenessa Man, Arup’s Technical Lead.

Speckle takes care of extracting geometry and data out of the most popular tools of the industry and has been used in extremely creative ways to drive data management forward. And how does this look IRL? Learn about key applications we’ve seen across our community, customers, and partners!
Reduzer’s Carbon Calculator Dashboard
The team built a carbon-free construction tool enabling business owners and developers to collaboratively manage their company’s carbon footprint using environmental data and insights. Watch Reduzer's Carbon Calculator Dashboard in action!
Speckle tools used: Speckle 3D viewer and BIM connectors.
Gaiup’s Real-Time LCA Tool
Gaiup has built a platform on top of the Speckle database that offers a dynamic and proactive view of emission insights and data. In addition, using Speckle’s 3D viewer allowed for high-quality and user-friendly visualisation and analysis, directly accessible from Gaiup’s web application, automatically synced with the underlying data. Watch Gaiup’s Real-Time LCA Tool in action!
Speckle tools used: Speckle 3D viewer and connectors.
Smart and Powerful Custom Dashboards
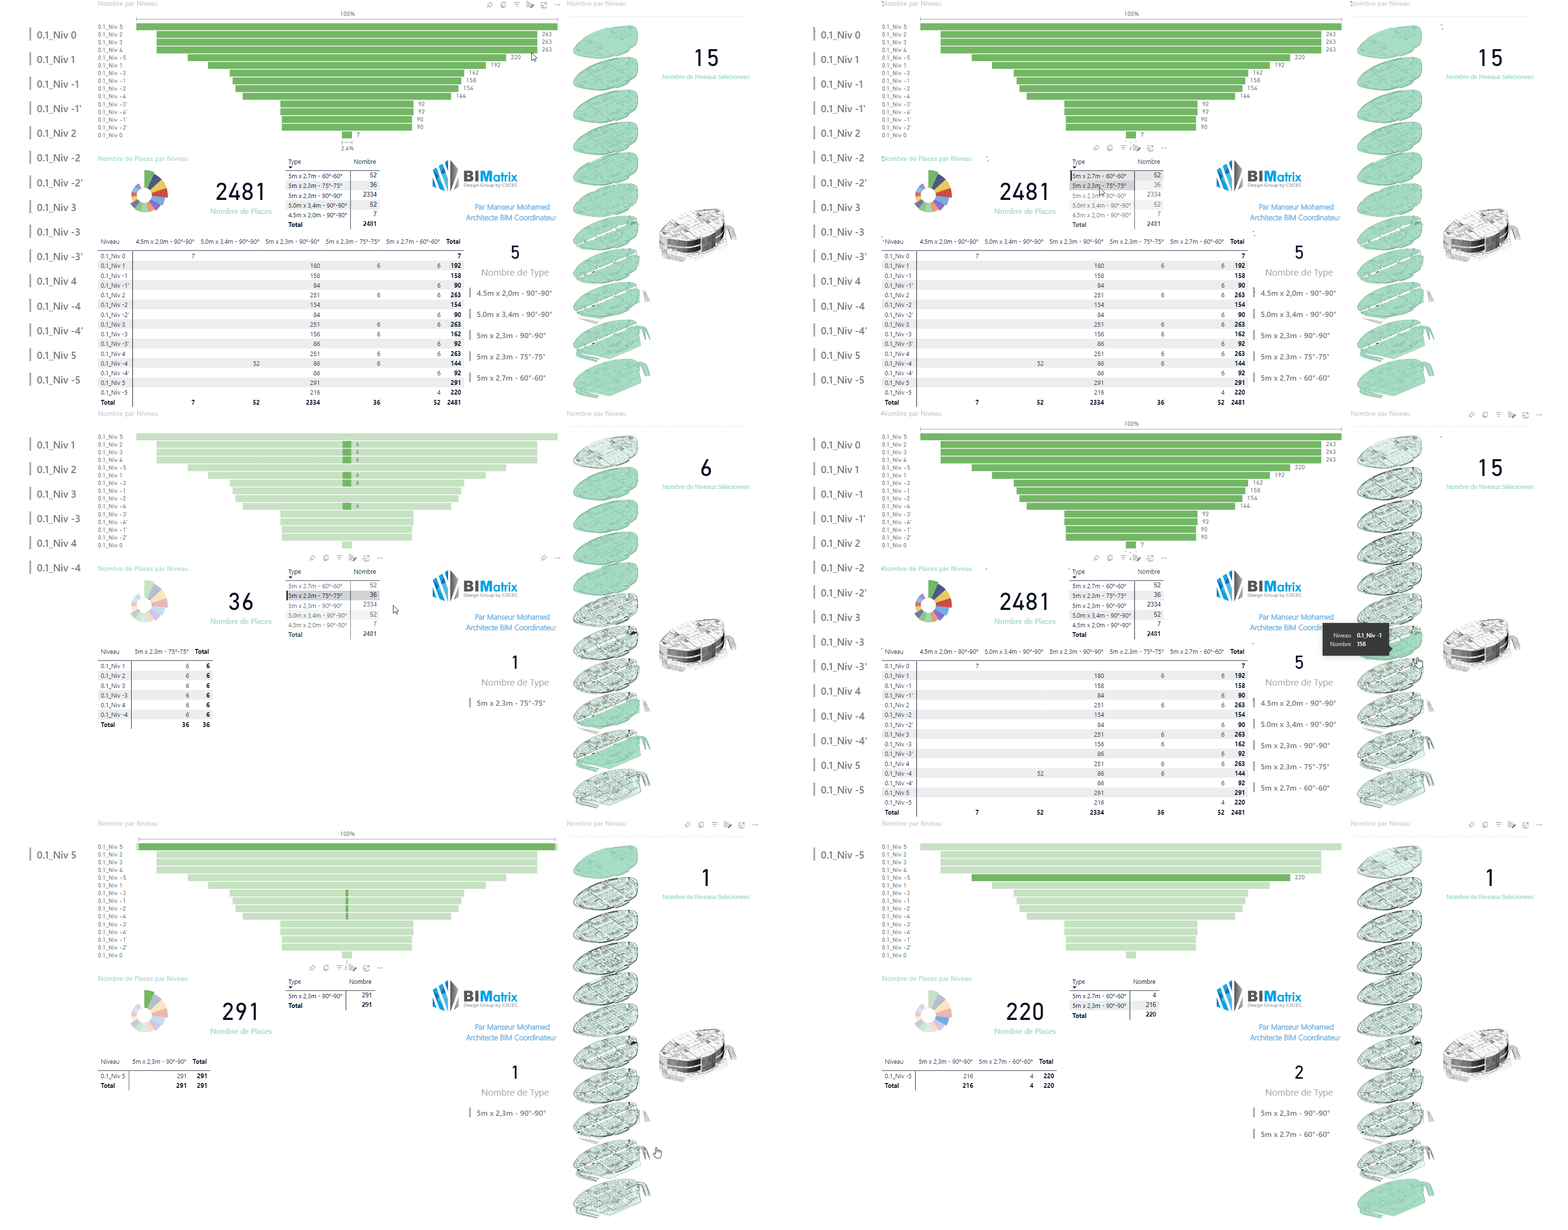
Mohamed Manseur, a Chief Architect and BIM coordinator at China State Construction (CSCEC) created interactive dashboards using Speckle and Power BI to better communicate modeling status with external stakeholders. Doing so helped the team shift from using paper to creating interactive data sheets for every room in a building. Read more about Mohamed's Custom Speckle Power BI Dashboards!
Speckle tools used: Speckle Power BI connector and 3D viewer.

::: tip
Browse through these short and easy-to-follow tutorials:
- Power BI YouTube tutorials
- Blog tutorials for Power BI
- Docs and Guide
- GraphQL API Docs
- GraphQL tutorial
- Viewer Docs
:::
Easily Connect BIM data and Excel Spreadsheets
This is a Speckle in-house tool, built to eliminate manual work and specialist tools when it comes to transforming Revit data into Excel sheets. Our Parameter Updater helps you harness the full power of spreadsheet applications, like Excel, to effortlessly update and manipulate data while syncing the changes back to Revit.
Find Your Inspiration for the Hackathon
Insider tip: the Business Intelligence category of our hackathon is a good fit if you are aiming to produce a low-code solution. However, if you're an experienced developer who can code custom dashboards and complex data visualisation tools, this can be a category to take to the win. It's all in the way that you use it!
We collected a few resources we think you’ll find helpful when brainstorming ideas with your team. You can start by watching our Power BI webinar below:
Amazing! But What Now?
As the AEC industry generates vast amounts of data, there’s a critical opportunity to harness this resource for strategic advantage. The Business intelligence category encourages the development of solutions that analyse data for insights, improve resource allocation, enhance strategic planning, and predict industry trends, positioning businesses to make informed, data-driven decisions.
And finally, a pro tip from the juror of this category, Aaron Atkison:
Be playful and think outside of the box and long term about the solutions you are trying to hack. Don’t be afraid to come up with a forward-thinking solution to the problem you are trying to solve. - Aaron Atkinson, BIM Lead at John Sisk & Son Ltd
Show us what you got and apply to our hackathon today!
You can get your Speckle account today and subscribe to our newsletter below if you'd like to receive more content like this:


